We agreed on a vulnerability metric we can’t compute
We keep reporting the wrong vulnerability number to the CEO.


Ask a room of security leaders which single vulnerability metric belongs in front of a CEO and you get a narrow range of answers.
They’ll give some version of exploitable vulnerabilities on critical or internet-facing assets, still open past remediation SLA. People might phrase it differently, but the components are the same three:
- Is it exploitable
- Does it sit somewhere that matters?
- Are we past the clock we set ourselves?
It collapses exploitability, exposure and business criticality into one line a board can follow without a vulnerability management background. It's a good answer. It's better than the total open count by a wide margin, and if you handed me a program tomorrow it's close to what I'd report.
Push anyone on that metric, though, and within about two minutes you get the same admission: it depends entirely on asset classification being accurate, and nobody trusts their asset classification.
I have had that conversation many times, and it almost always arrives as an aside. The metric is only as good as the asset data underneath it. Classification and ownership are the bigger problem. Then the conversation moves on, because the metric is the interesting part and the data is the boring part.
Why have we settled on an answer we cannot produce the inputs for?
The popular critique is that total open vulnerabilities is a bad metric because 10,000 findings on low-risk internal systems matter less than 50 exploitable ones on critical internet-facing assets.
Yes, but that's still an argument about ranking. The problem is the data being ranked. A good share of it describes things that aren't there.
We keep having the ranking argument because it's the one we know how to have. It's a whiteboard exercise you can finish in an afternoon. But fixing what sits underneath is complex work that will take you two years and the industry hasn’t settled on how to fix it.
Failure one: precision
Most scanning is a matching exercise. Read the dependency manifest, pull component names and versions, check them against advisory feeds, report the matches.
At the job it was built for, this works. A known-vulnerable version of a package you deliberately installed, sitting in your manifest, gets found. That’s coverage every organization should have.
Then we started asking these tools a different question. What is actually in my build, and can anything reach it?
There was nothing else to ask, so we asked the scanner, and the scanner cannot answer it. It cannot tell you whether the vulnerable version is in the built artifact, whether the vulnerable function is reachable from any code path you execute, or whether the thing you scanned is the thing you deployed. It produces findings that are true statements about a manifest and false statements about your software.
At Kusari, we measured this on ourselves and on two widely deployed tools, on the same codebases under the same conditions. Our false positive rate came in under 2%. Both of the others came in above 50%.
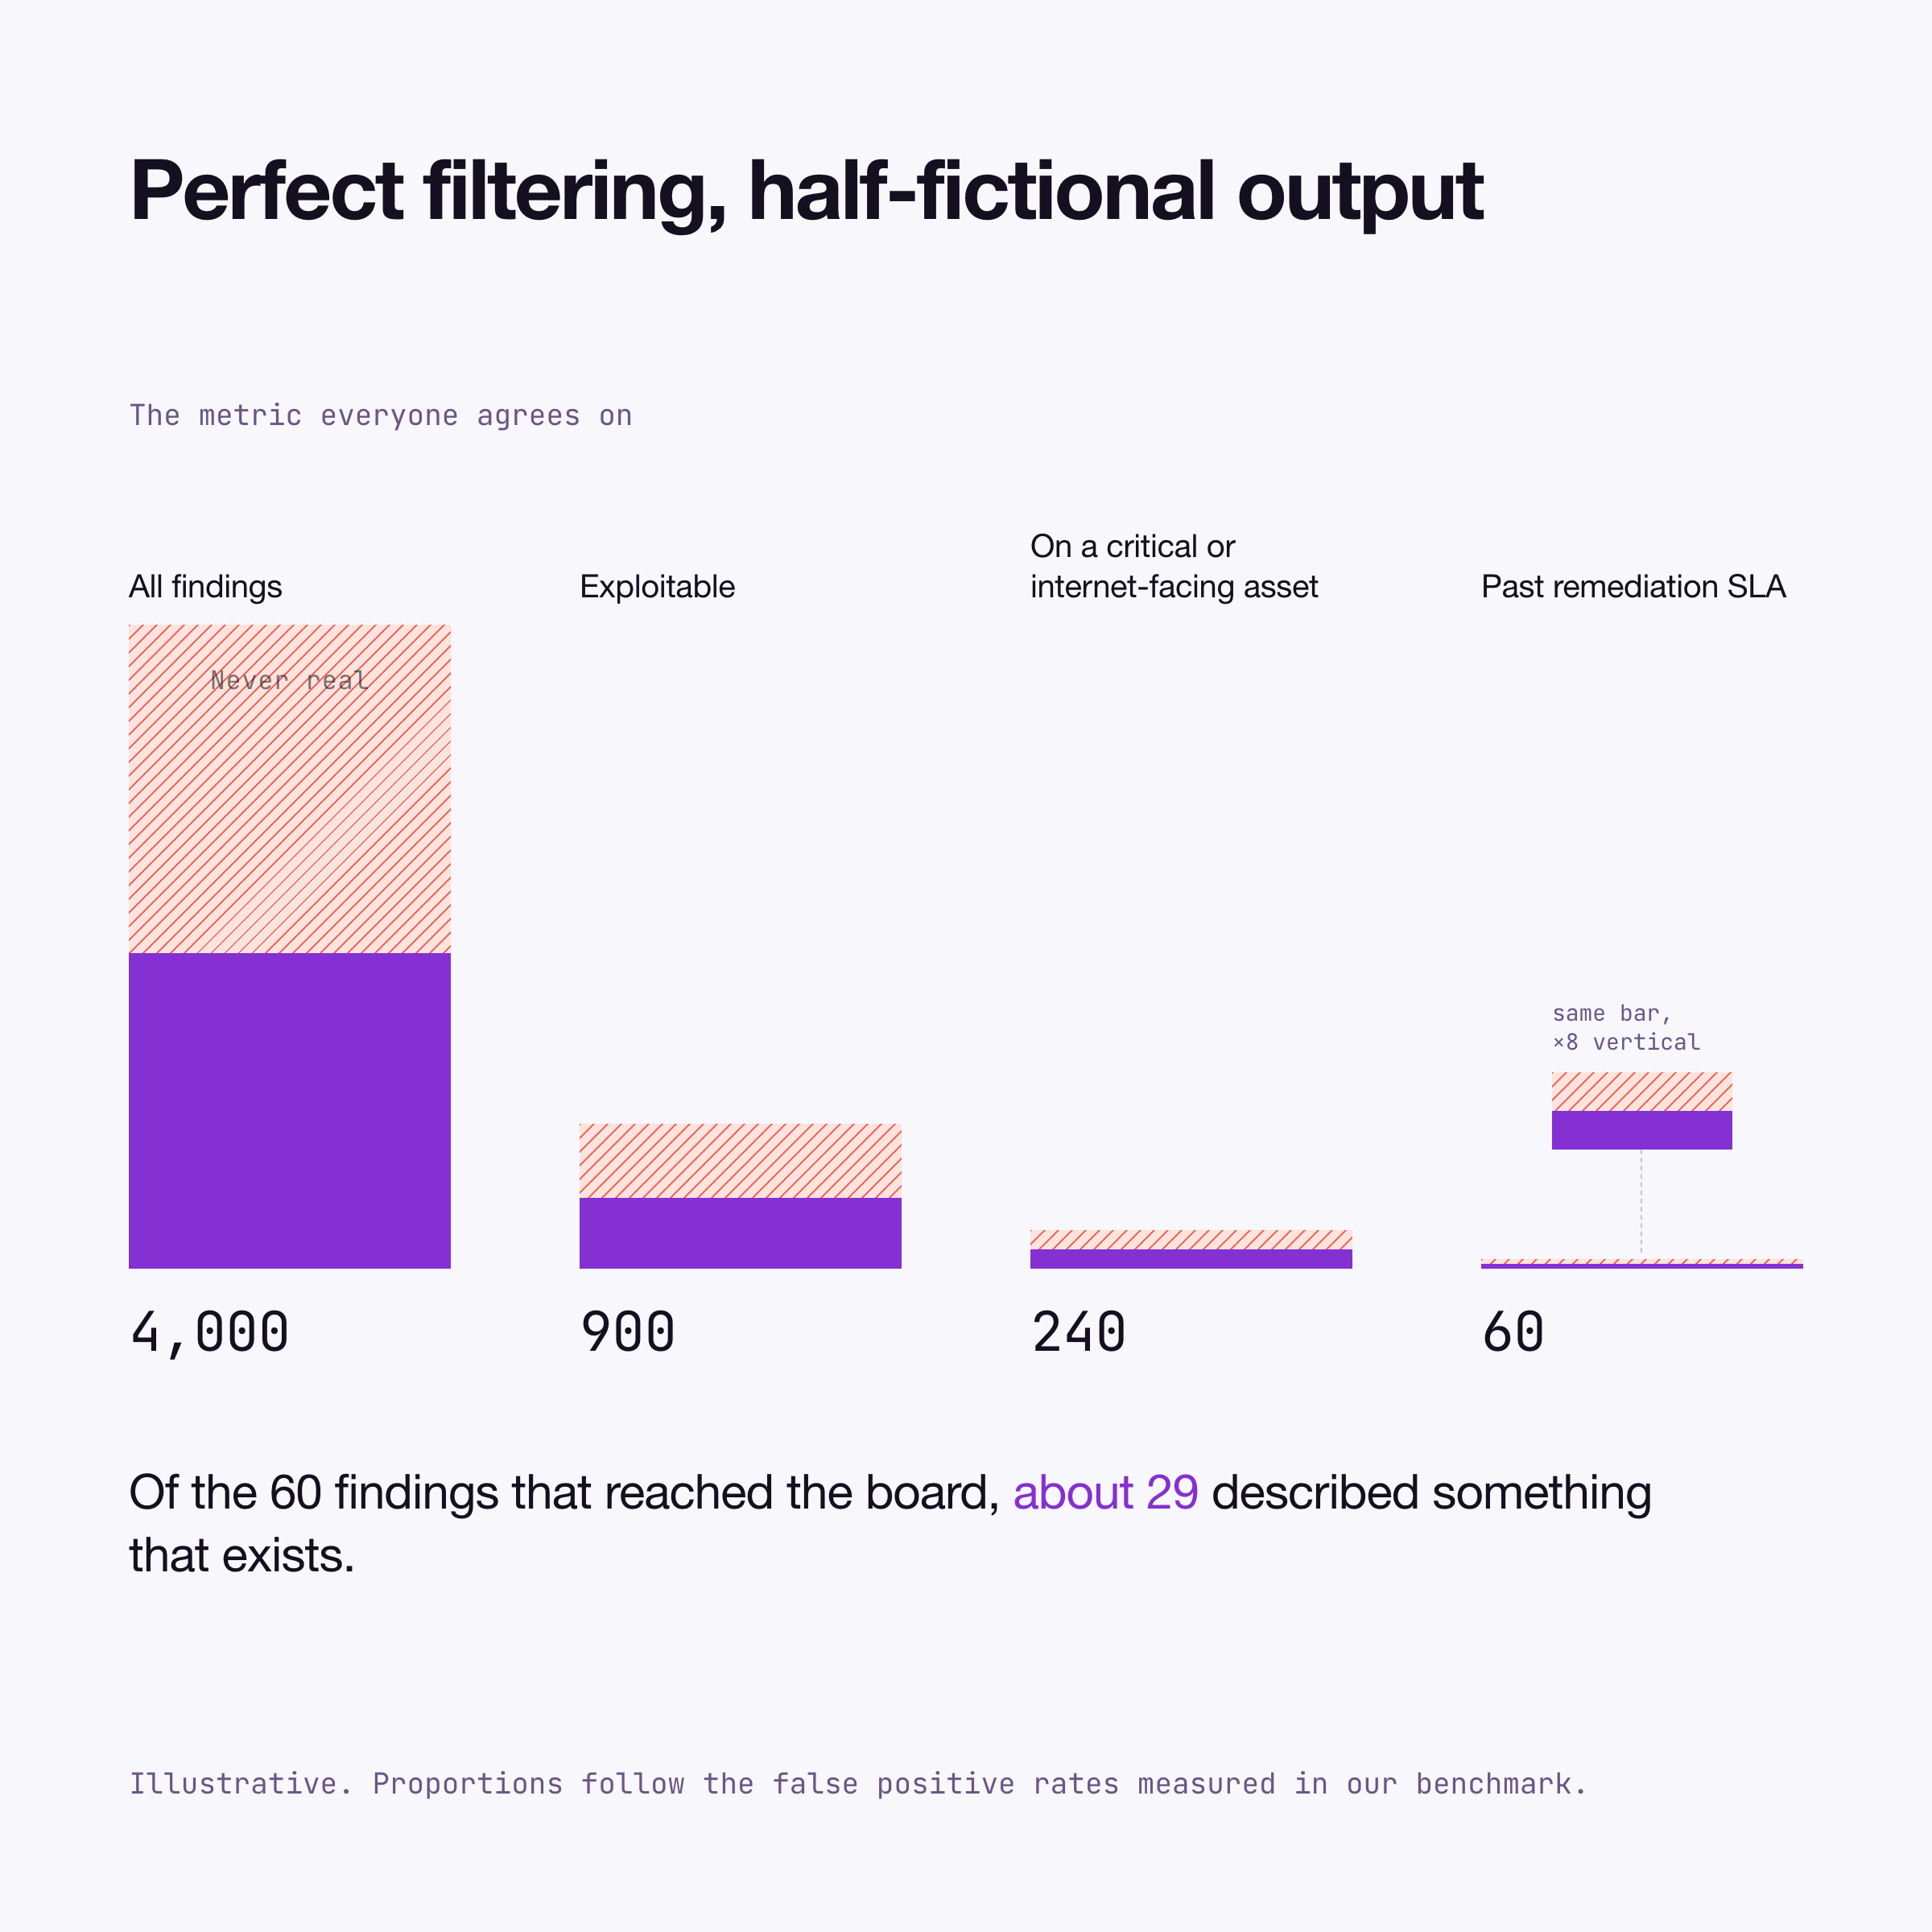
Nobody has been hiding this. The architecture has worked this way for a decade and everyone in the industry knows roughly what it costs. We have collectively agreed not to put a number on it, because the number is embarrassing for all of us and there was no competitive reason to be the first to publish one.
Now apply 50% to the metric everyone picks. Exploitable vulnerabilities on critical assets past SLA is computed by filtering a finding set. Filter a set that's half noise and you get a smaller, more official-looking pile of noise, formatted for a board.
Failure two: provenance
Even when a finding is real, most organizations can't place it. What's in this artifact? Which transitive dependency pulled the component in? Who published it? Did any of that change last week?
People underestimate how much of this is invisible. J.P. Morgan's research puts roughly 95% of open source vulnerabilities in transitive dependencies, the ones chosen for your developers, not by your developers. The average JavaScript project carries about ten direct dependencies and close to 700 transitive ones. Almost all of your exposure lives in the part of the tree that your developers never looked at.
ENISA's SBOM adoption report from June measures the blindness directly: 7% of organizations have fully closed the gap between generating SBOMs and using them to improve security posture. A majority of respondents don't know whether or how SBOMs are consumed inside their own organization. We solved generation and then stopped, because generation was the part that satisfied the auditor.
Whack-a-mole is losing, and agents make it lose faster
David Adrian published a piece last month arguing that finding and patching vulnerabilities is a skill security teams need and a bad thing to organize around. He splits the numbers in two. How many problems you found proves your sensor is working. How often a class of problem keeps recurring tells you whether the system underneath is improving. Most programs report the first number and treat it as evidence of progress. His prescription is that defenders should articulate invariants about what should be true, then encode them so whole classes stop recurring.
Discovery is nearly free now and remediation is getting cheaper, so the tempting read is that reactive security finally scales.
It doesn't, and the reason is arithmetic. Code volume is growing exponentially because engineers have agents, too. Enumerating vulnerabilities across that codebase costs defenders exponentially. Finding a handful of useful ones costs attackers polynomially. A cheaper diagnostic doesn't change the outcome, it just lets you lose the same race at higher speed.
Where I'd push the argument is most of the code you're responsible for isn't code you wrote. You can't refactor a transitive dependency four layers down. You can't encode a safe abstraction into a package maintained by one person, and roughly 18 million packages list exactly one maintainer. Safe languages, better interfaces, invariants enforced in CI: all real, all available for first-party code, and unavailable for the rest of the tree. Which is where the incidents keep happening. Backstage, Mastra, the Injective SDK, ChainDrop. None of those were bugs in code the victims wrote.
So in the supply chain the invariant can't be a property of the code. It has to be a property of the boundary. What am I permitted to depend on? What got in? How did it get in? Did anything I execute reach it?
That's provenance, and the industry has spent five years filing it under compliance while the attacks kept arriving through the exact door it was supposed to be watching.
My argument for two key metrics
I’ve landed on two metrics to present to the CEO, and neither is a count.
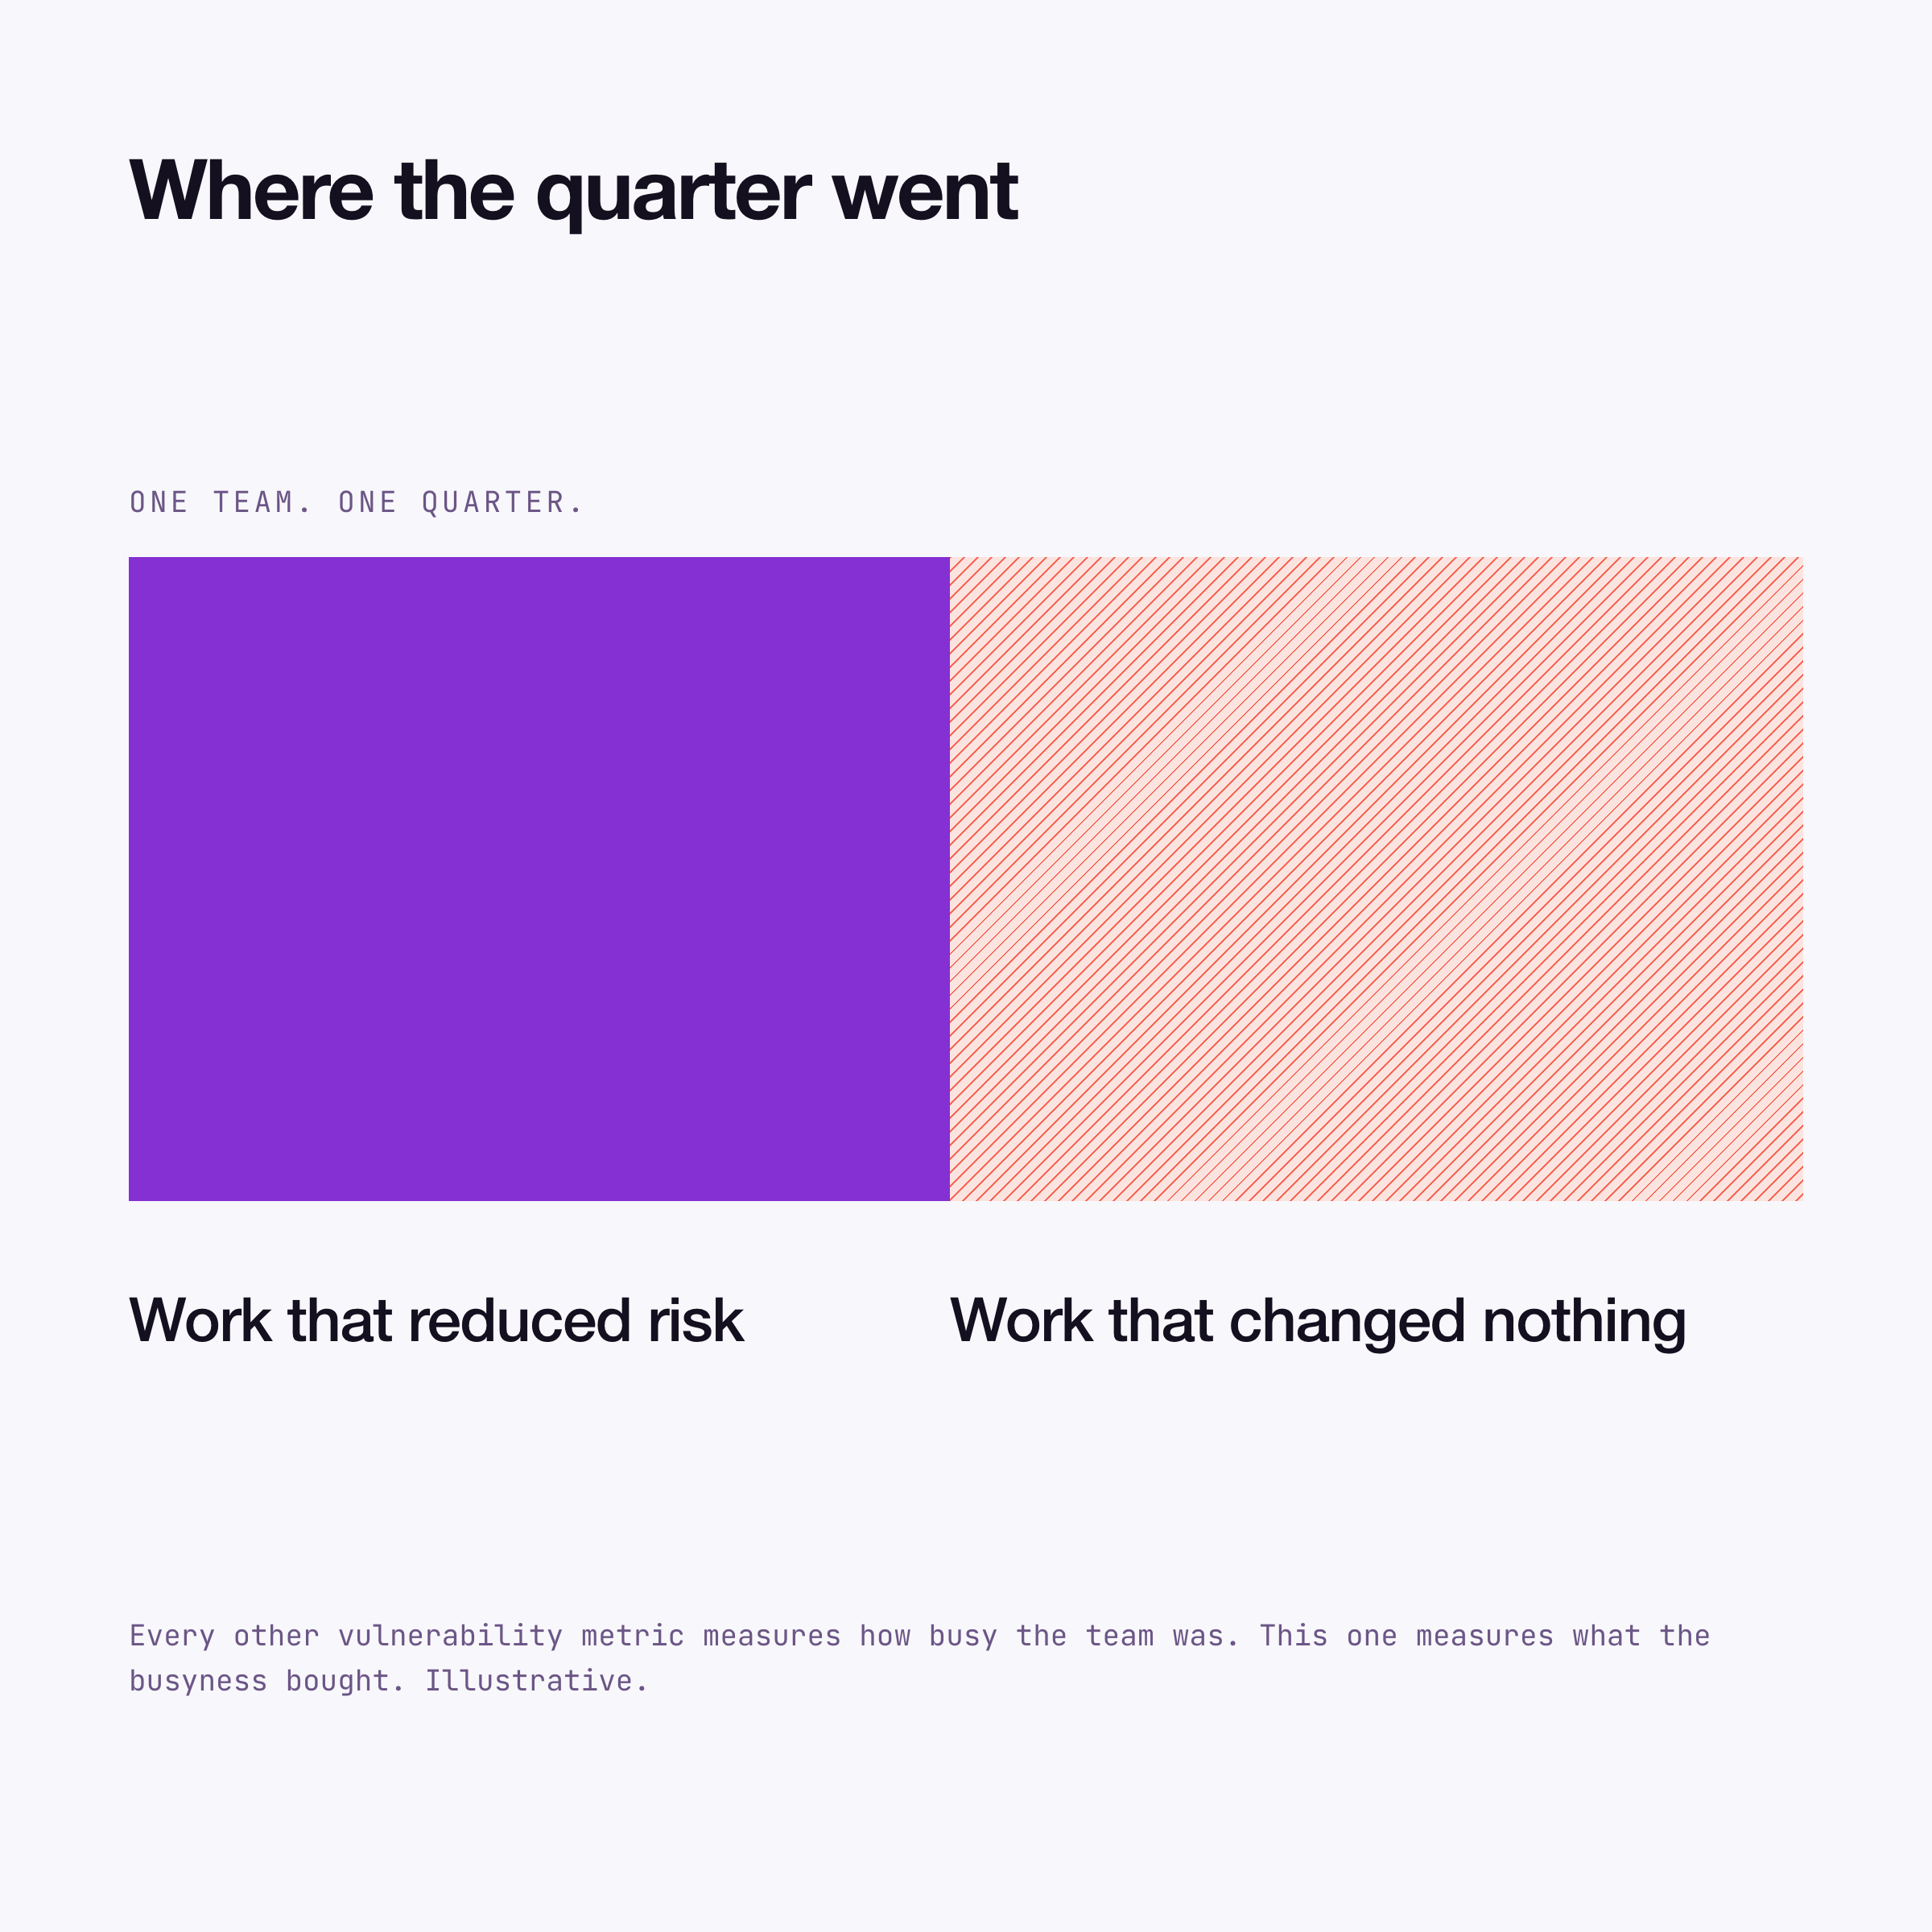
- Precision. What share of the findings we acted on last quarter turned out to be real? I rarely hear anyone propose this one, which is interesting. Every metric in the standard conversation — count, KEVs past SLA, MTTR, tickets closed — is denominated in workload. Precision is denominated in capacity. It tells an executive how much of the most expensive and least scalable resource in the organization went to work that changed nothing.
- Recurrence. Is this class of vulnerability appearing less than it did six months ago? That is Adrian's outcome metric, and it is the one that answers whether last quarter's investment did anything. "We closed more tickets" does not answer it. "This class of exposure occurs 60% less than it did in Q1, here is the trend" does.
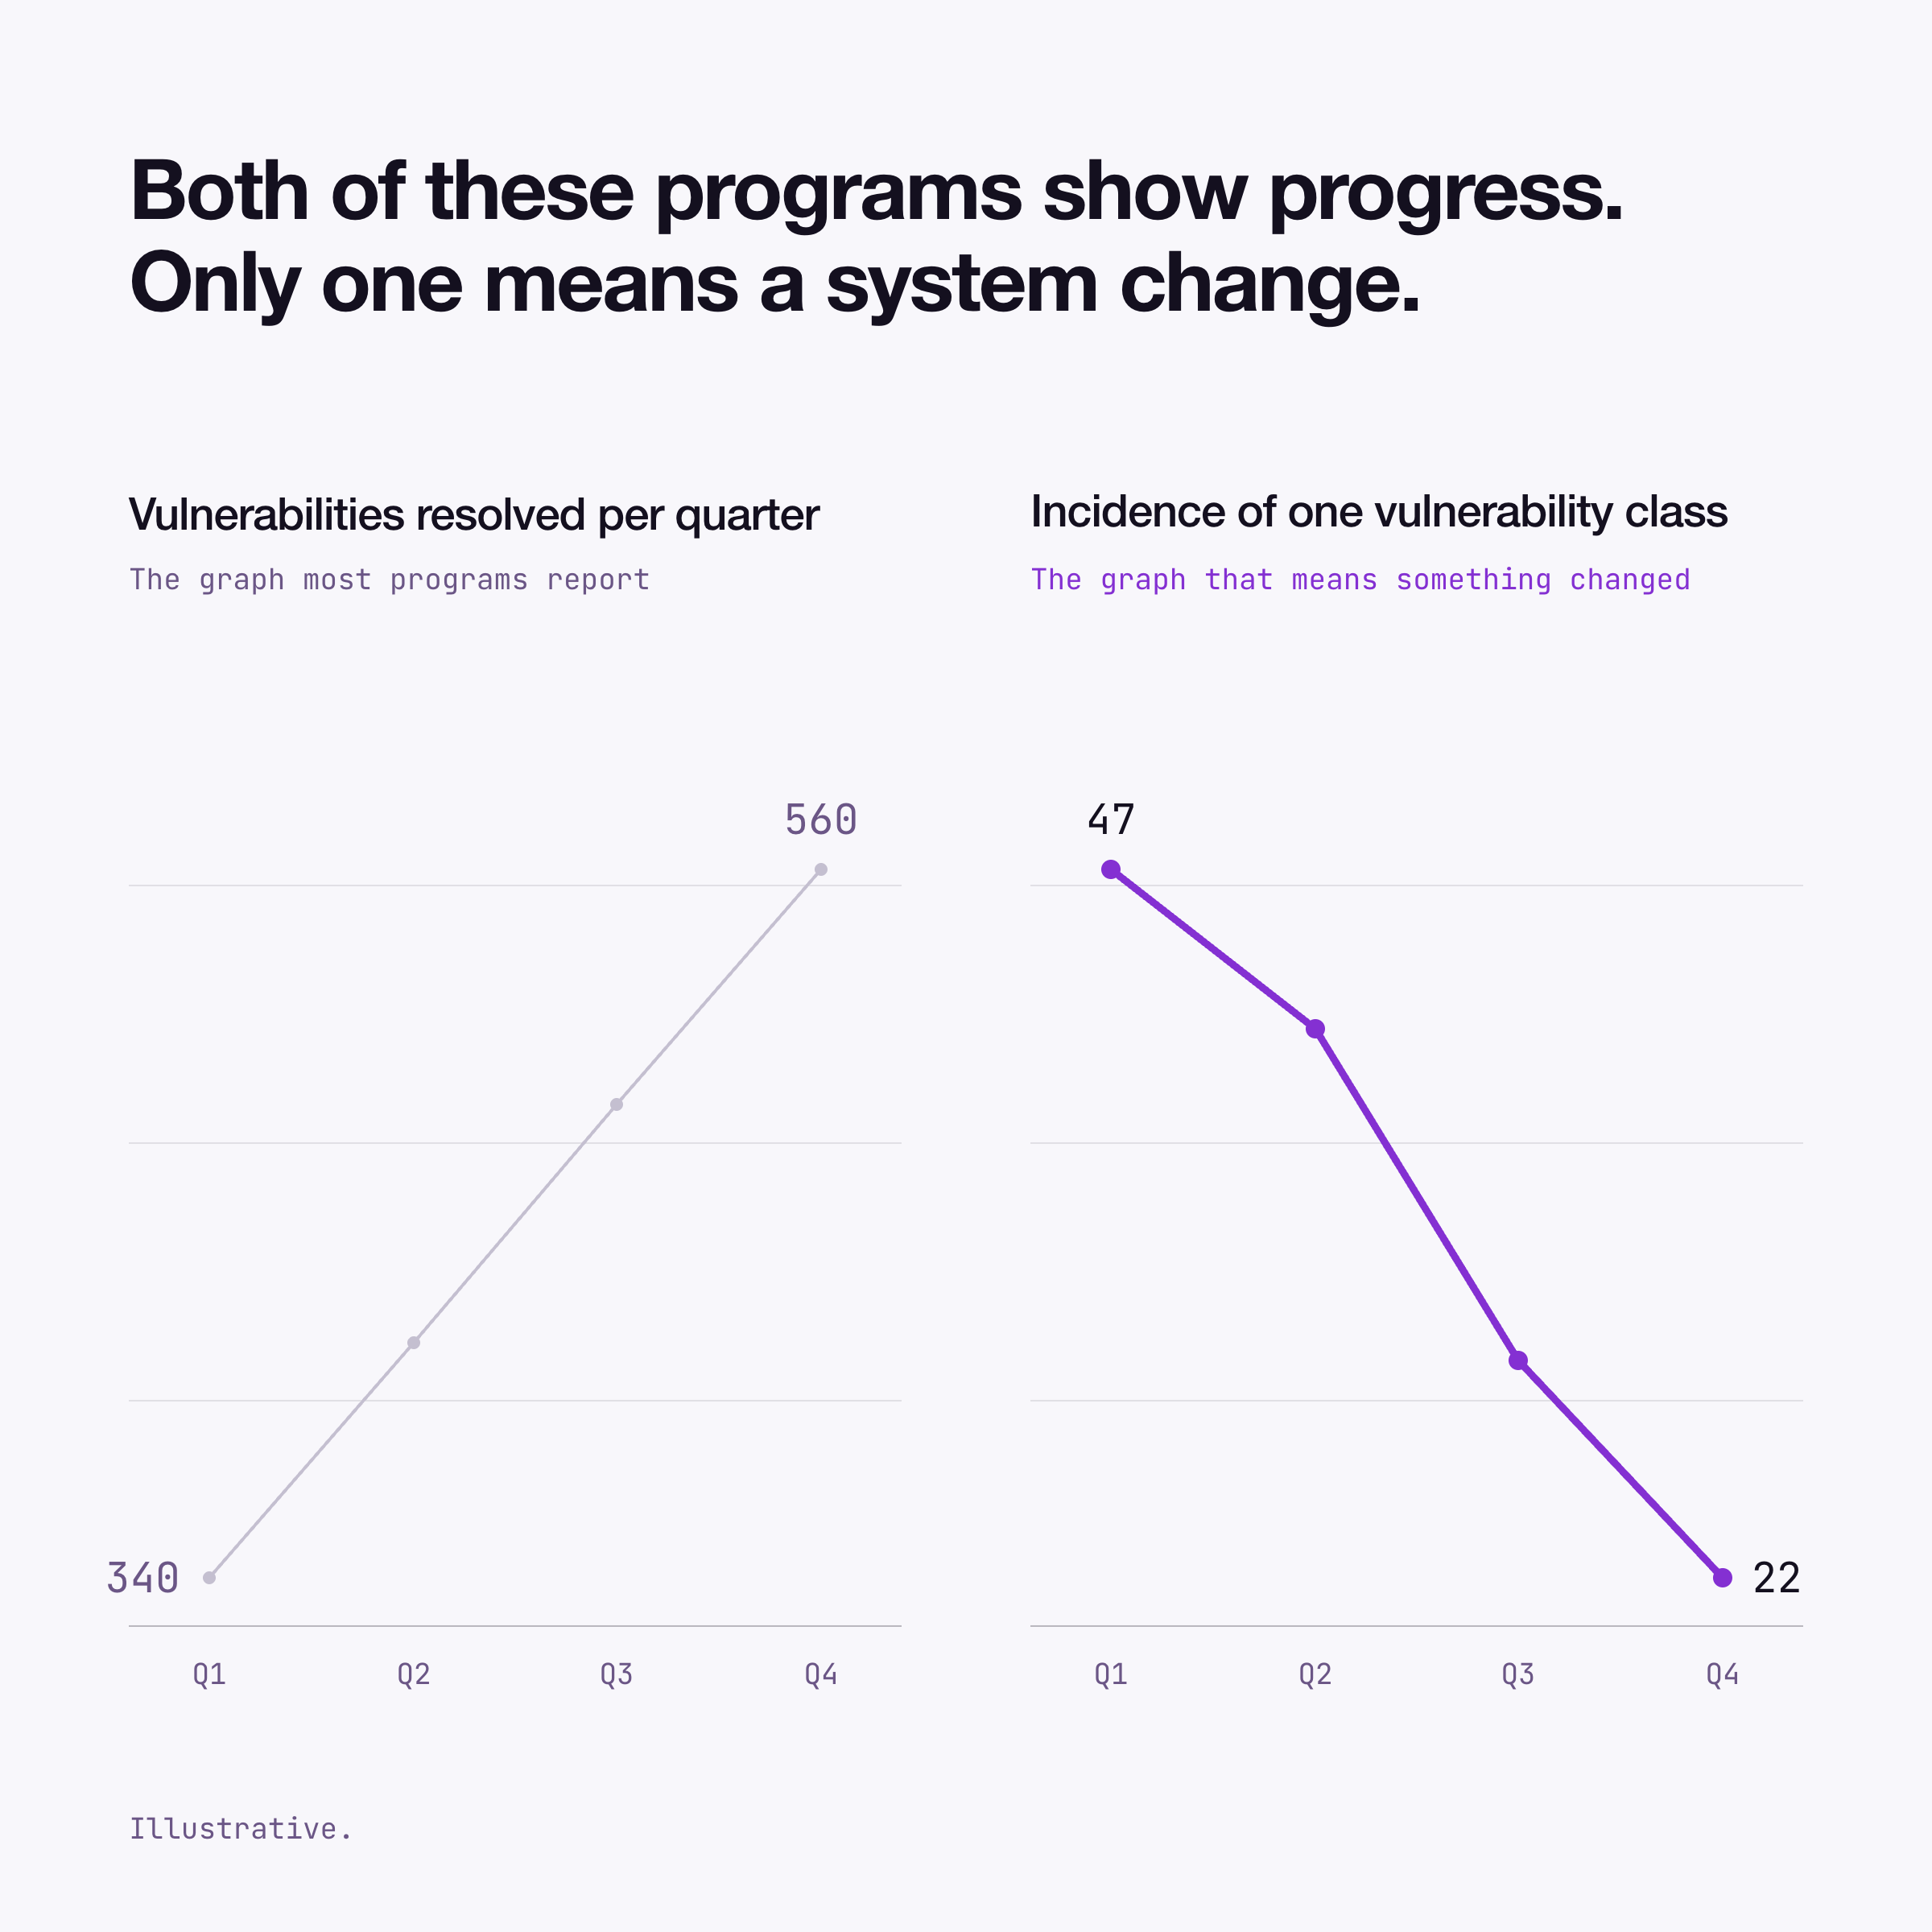
These two work together. Getting precise is what frees the engineering time up. Recurrence is the thing worth spending it on, and without the first you never have enough of the second to try.
Why this matters more than a dashboard
My co-founder Mike Lieberman asked something recently that I don't yet have a clean answer to: what actually moves an executive to fund preventative security?
He wasn’t talking about detection or response. He meant the work that keeps a vulnerability dependency from getting merged at all, and his point was that we already built it. Nobody in this industry is short of tooling and getting an organization to turn it on has never been an engineering problem.
Compare it to cloud and AI, which got funded because they arrived carrying a number executives already knew how to buy: throughput. How much time to stand up a service? How much output per engineer? Security arrives carrying vulnerability counts and mean time to remediate, which measures how busy the team is, and a CFO hears busy as expensive. We have spent twenty years walking into budget meetings with our own workload and calling it a risk report.
Precision is what translates. Fifty percent waste in the most constrained engineering resource in the company is a capacity number, and a CFO can act on it without knowing what a CVE is.
I recognize that’s not a full answer to Mike. Preventive security is harder to fund than an enabler and probably always will be. But we have spent two decades handing executives the wrong number and then being surprised they didn't act on it.
Beware the trap
Executives have spent a decade learning that a bigger number means the team is failing. You cannot swap the number without unwinding that first, and that is the wall every metric change runs into.
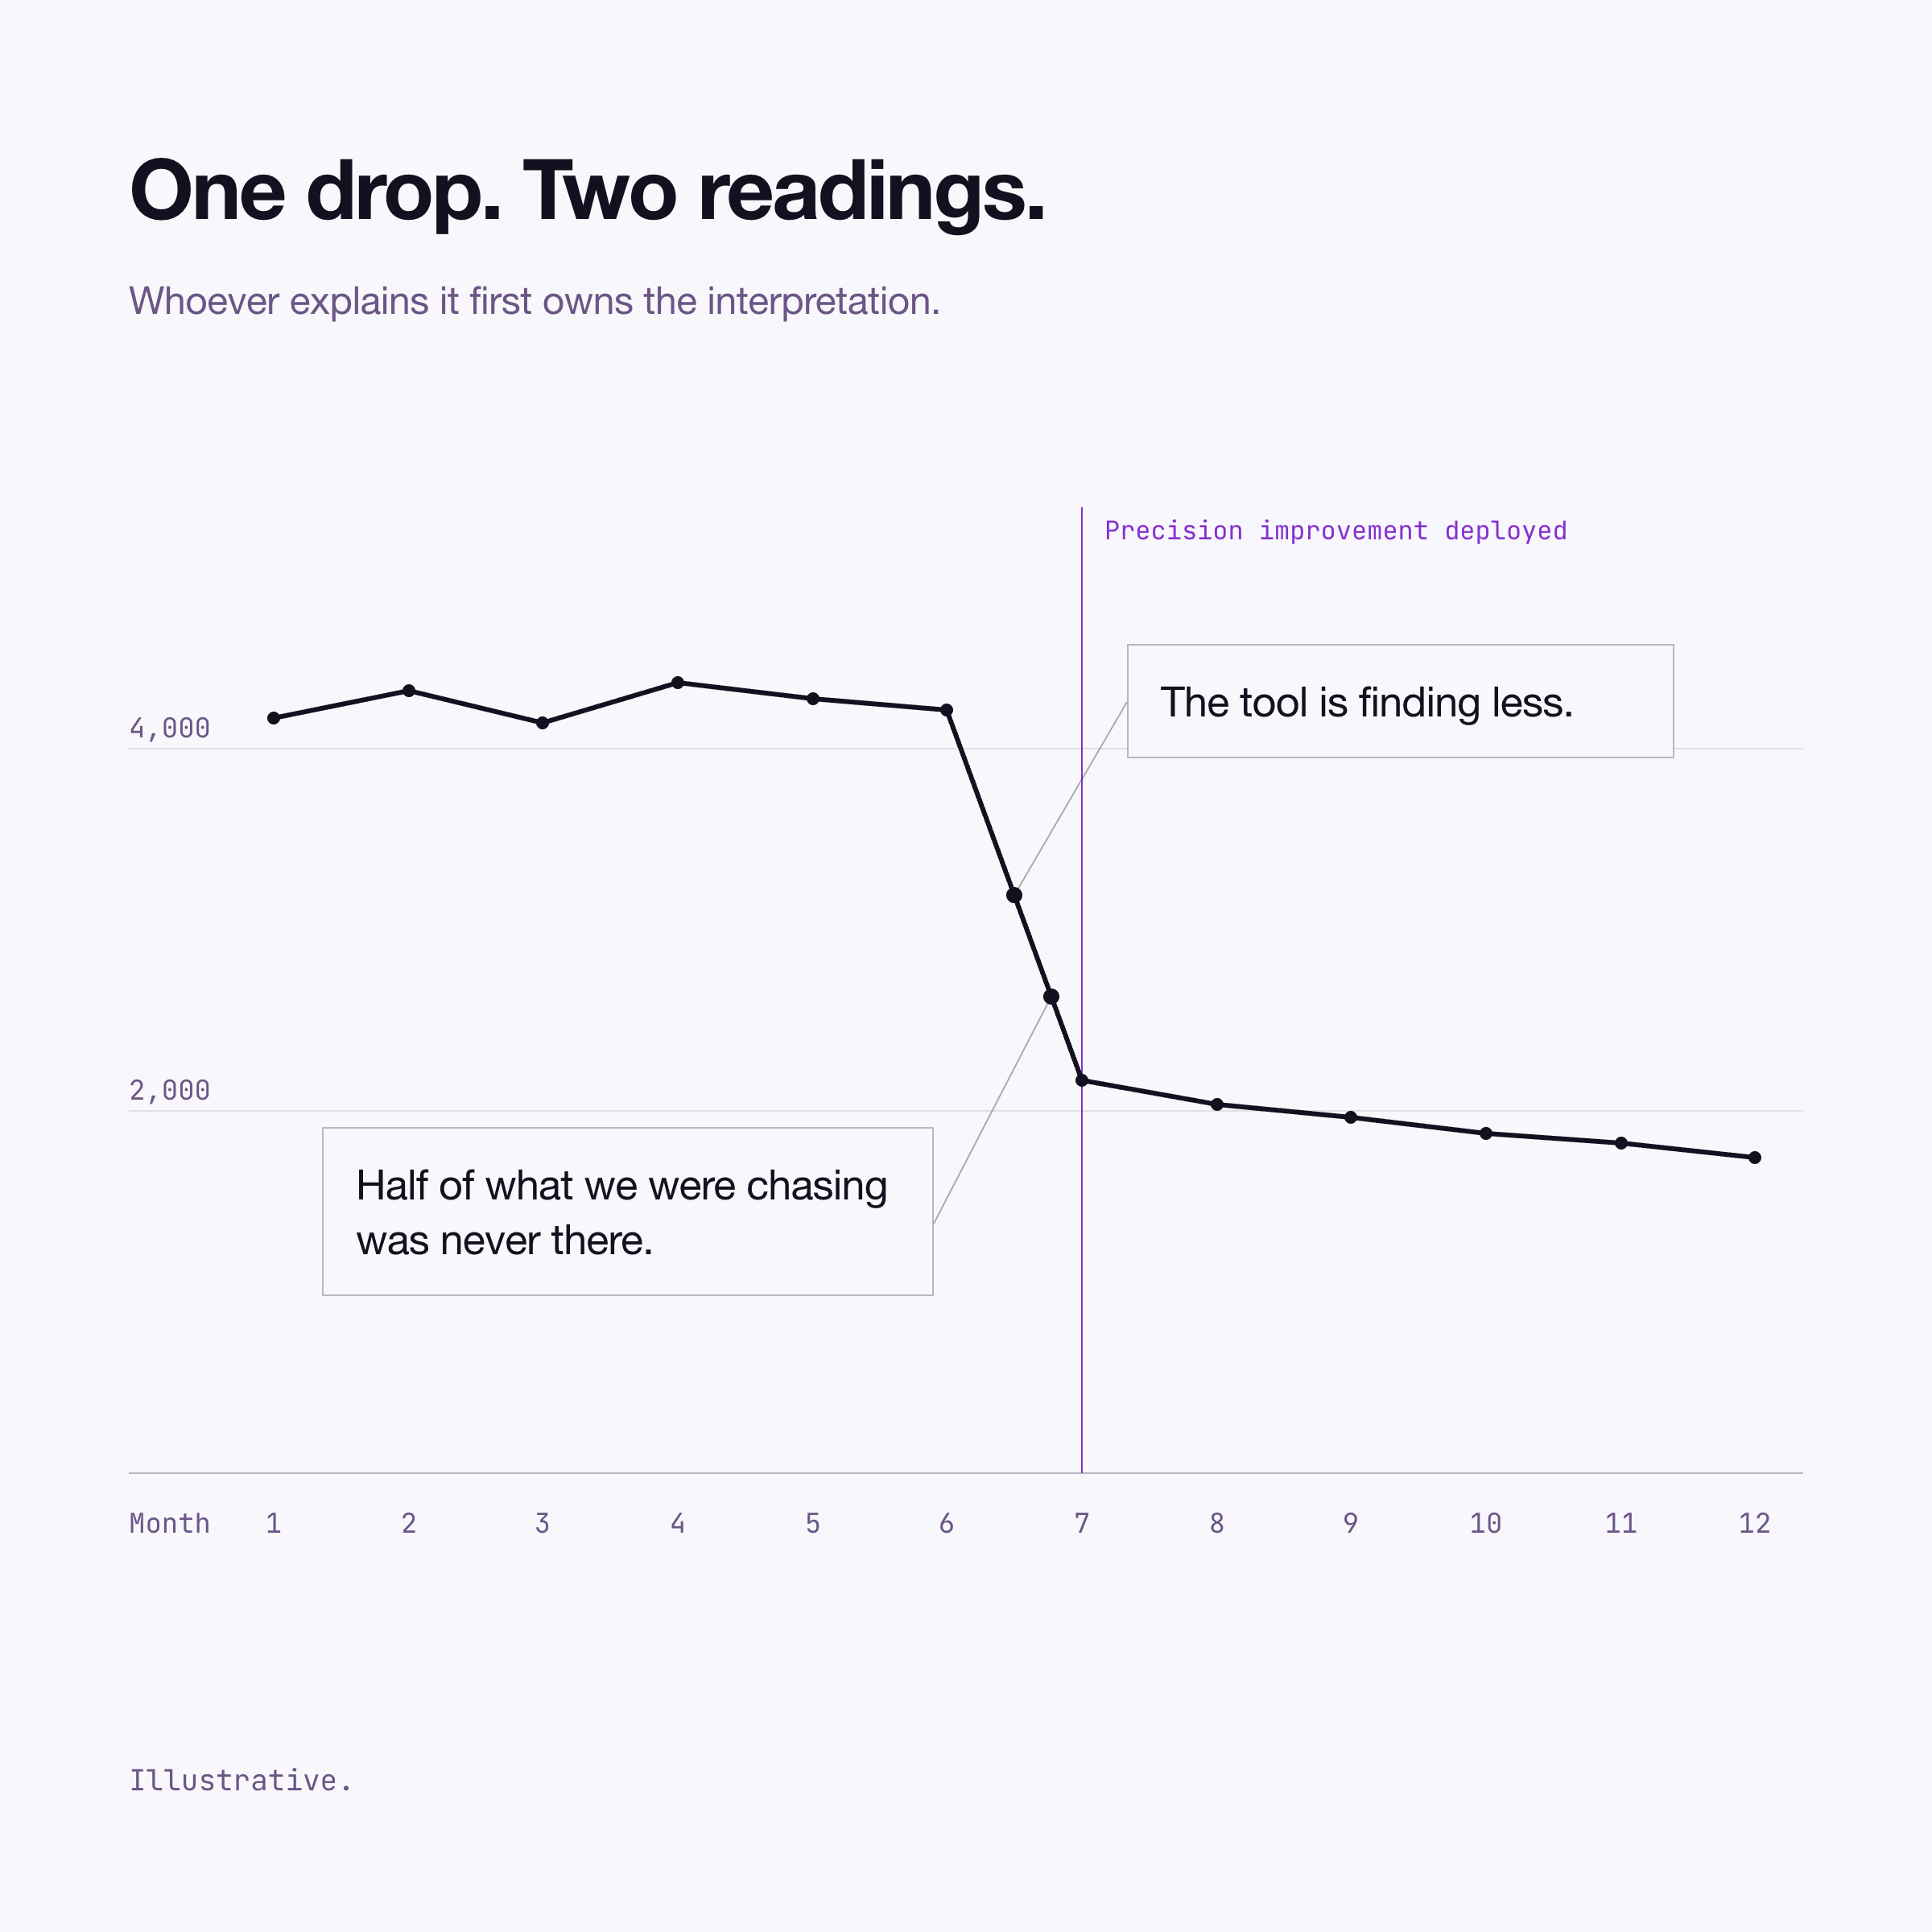
Your total count drops because you got more precise, and somebody reads it as the tool finding less. Your KEV-past-SLA number won't fall as fast as the raw count used to, and somebody reads that as backsliding. Improving the instrument makes the dashboard look worse before it looks better, and the person holding the dashboard has a review cycle.
No cleverer metric gets you out of it. You change the number, you explain the change in the same meeting with the methodology attached, and you accept that quarter one is an argument. Any metric worth adopting survives that argument. Total open vulnerabilities has held its place on executive dashboards for a decade largely by never starting one.
So can anyone compute it?
Kusari can do the software half. Building the graph from source is what makes a finding placeable. It’s in this component, in this artifact, reachable from this code path, currently exploited or not. That is the part most tools guess at, and it is why our false positive rate sits where it does.
We cannot tell you which of your services matters. Internet-facing, tied to payments, the one the board would ask about first. That is the asset classification that lives in your CMDB or in somebody's head, and it is the other half nobody in this industry has solved. If you have it, we can do the rest. If you don't, the metric stays out of reach, and no vendor including us can hand it to you.
That is a smaller claim than this category usually makes. It is also the one I can defend.
Where to start
Three things you can do without restructuring the program:
Measure your own precision for one sprint. Take a single team's queue, track every finding they acted on, record whether it was real. Two weeks and you have the number. It's also the cheapest vendor evaluation available to you, and you can run it without telling anyone.
Pick one bug class and chart its incidence. Not resolutions. Incidence, six months back if you have the history. Flat or rising means your remediation velocity isn't buying anything structural, however good the ticket numbers look.
Take ten findings at random and prove the component is in what you actually deployed. If you can't, you've found the gap sitting underneath every metric you currently report.
None of that needs a budget line or a new tool. What it needs is a willingness to find out that the number you have been reporting for three years does not mean what you thought it meant, in front of people who have been reading it that whole time. That is the harder part, and it is why most programs will keep reporting the count.